
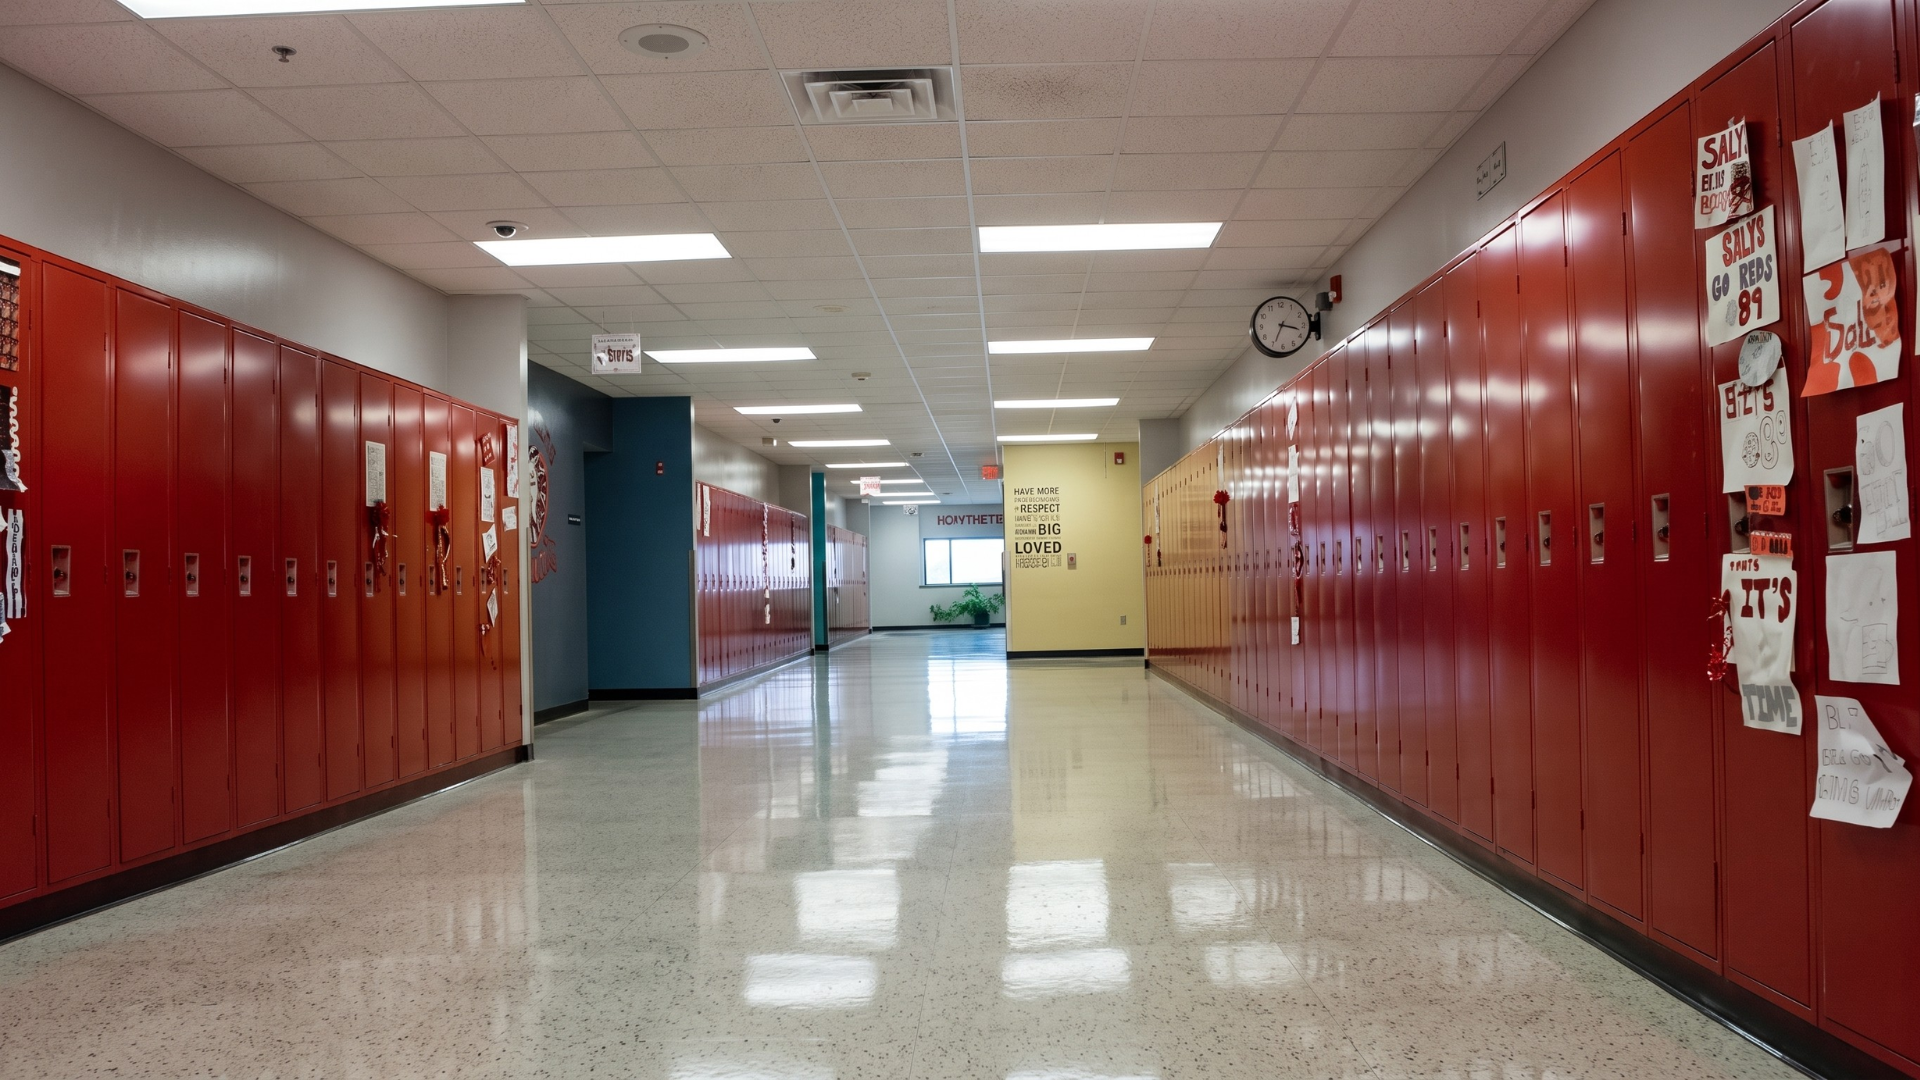
More than 1,200 Texas public school buildings enrolled fewer than half the students they were built to hold last school year, and 111 classroom buildings sat vacant, according to the first statewide school facility usage report, released Nov. 12 by the Texas Education Agency. The numbers give lawmakers their first apples-to-apples look at how much classroom space districts are paying to keep open as enrollment shifts.
Across 7,077 active instructional buildings, Texas districts enrolled 4,337,047 students in space the districts built for 5,738,418, according to the 2025-2026 Facility Usage Data Statewide Summary Report. That gap of roughly 1.4 million seats means the typical building ran at about three-quarters of capacity.
The report exists because the Legislature required it. House Bill 2 and Senate Bill 12, both passed in 2025, added Section 7.0611 to the Education Code, directing every independent school district to report each year how its buildings and land are used and TEA to publish the results. SB 12 also gave the requirement teeth: a district that does not file cannot turn away a transfer student on the grounds that a campus is full, according to the Senate’s analysis of the bill. TEA also launched an online data tool that lets the public look up individual districts.
The data has consequences beyond transfers. The statute’s stated purpose is to guide decisions about how buildings are used, and the report arrives as districts across the state weigh campus closures and consolidations, where the cost of operating half-empty buildings is a recurring argument.
The report found that of the 7,218 instructional buildings that reported both enrollment and capacity, 1,228, about 17 percent, enrolled fewer than half the students their adjusted capacity allows. At the other end, 1,094 buildings, about 15 percent, were at or above capacity. The rest fell in between. Adjusted capacity is TEA’s measure of the most students a building can serve at one time, adjusted for the instructional or operational practices a district uses, under the agency’s rule in the Texas Administrative Code.
The pattern varies by region. The Houston-area education service center region had the most buildings under half full, at 155, followed by the Richardson region in North Texas with 133 and the Fort Worth region with 95, according to the report’s regional tables as read by The Texas Dispatch. In the El Paso region, half of the 86 reporting buildings were under 50 percent, and only two were at or above capacity. The San Antonio region reported the most vacant instructional buildings, 20.
The report covers more than classrooms. Districts reported 17,763 facility records spanning about 1.1 billion square feet and 315,397 acres, including stadiums, parking lots, warehouses, transportation yards and undeveloped land.
TEA cautioned that the figures are self-reported. Of 1,017 school systems required to file, 946 submitted usable data, 36 filed incomplete or flawed data and 35 submitted nothing, according to the report. The agency did not independently verify the numbers except where it corrected obvious errors; one facility originally reported an enrollment of more than 13.7 million students. Charter schools are not covered by the law and are not included.
The data does not say which buildings should close, and district leaders weighing closures often point to factors the counts do not capture, including neighborhood growth, bus routes and the cost of consolidating. Districts cannot change their 2025-2026 entries but may correct them in the 2026-2027 survey. [Draft says TEA will open it “later this year”; the first survey ran April 9 to May 15, 2026. Confirm the date in the Nov. 12 letter.]
The Legislature, which convenes Jan. 12, 2027, will have the report in hand as it takes up school finance again, including the proposals to raise per-student funding filed this month.
Key facts
- TEA released its first statewide school facility usage report Nov. 12, 2026, required by Education Code Sec. 7.0611 (HB 2 and SB 12, 2025).
- 1,228 of 7,218 reporting instructional buildings (17%) enrolled under half their adjusted capacity; 1,094 (15%) were at or above capacity; 111 were vacant (TEA report).
- Active instructional buildings: 4,337,047 students enrolled vs. 5,738,418 adjusted capacity (TEA report, Table 7).
- 946 of 1,017 required systems filed usable data; 35 filed none; charters excluded (TEA report).